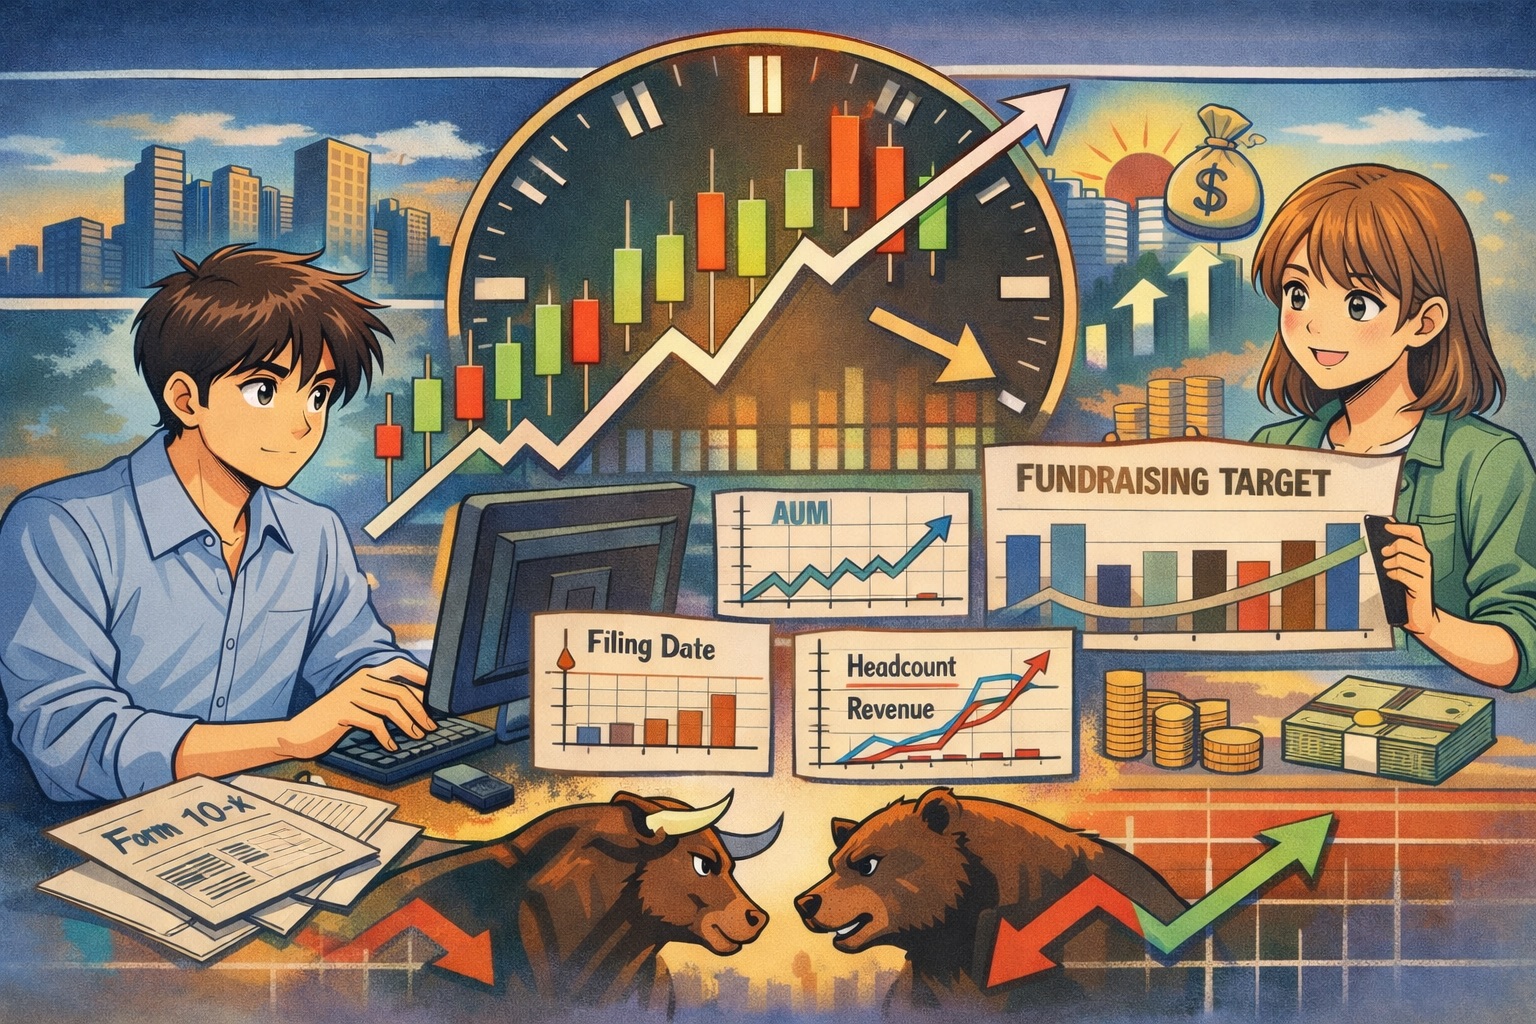
In finance, time series data is not optional
We are continuing our data series (see our previous pieces on The Modern Data Stack and In Search of a Data Tribe), and this time we are exploring time series data. One thing is clear: this is foundational infrastructure.
Why is time series data so important?
In finance, most decisions depend on trajectories rather than static values. A single observation can be misleading, but a sequence of observations tells a story. That story is often the difference between a good investment and a bad one.
Time series data is therefore fundamental in finance because the real signal is the trajectory. Investors care about direction, persistence, acceleration, and change.
Take distribution momentum as an example. Limited Partners don’t track distributions as isolated events. They track changes in cash-flow patterns over time. The signal is not a single data point, it’s the trend.
A simpler example is the evolution of a manager’s fundraising target over time. The target fundraise can often change. Being able to track those changes provides far more insight into capital-raising dynamics than a single snapshot ever could.
The same applies to many key financial indicators.
Assets Under Management (AUM) is a good example. Understanding whether a manager experienced steady growth over ten years, or a sudden spike driven by one large investor, can completely change the interpretation of their business. A single AUM value does not tell you whether growth is sustainable, cyclical, or driven by exceptional one-off events.
Headcount versus revenue growth is another strong example. Tracking employee count over time and comparing it to revenue trends can reveal a lot about operational efficiency, scalability, and whether growth is healthy or artificially inflated. And the examples go on.
From importance to implementation
Now that we understand why time series data matters, we can talk about how it is actually built in real systems.
In an ideal world, data would be perfectly tracked and shared the moment it becomes available.
Imagine this scenario.
A company publishes its Form 10-K on December 31st, end of day. Consumers can access it immediately. Your system ingests the filing instantly and uses the ingestion timestamp as the “as of” date for new data points. The balance sheet reports values as of December 31st, and everything lines up cleanly.
Simple. So why make it complicated?
Because this world doesn’t exist.
In practice, 10-Ks are filed with a delay, often weeks or months after the reporting period ends. Consider this real example. Apollo BDC (CIK: 0001837532) published its 10-K for the period ending December 31, 2024 on March 13, 2025.
That’s more than 60 days after the end of the reporting period.
Now we have two different dates.
- The reporting date (effective date): December 31, 2024. This is the date the financials describe. It represents the economic reality.
- The filing or ingestion date (knowledge date): March 13, 2025. This is when the market actually knows the information.
This distinction matters.
If your system blindly uses the ingestion date as the truth for historical analysis, you are potentially falsely assuming that the information was known earlier than it actually was. This can render historical data inaccurate and introduce a serious issue in finance: look-ahead bias. This is how backtests become unreliable. Your model appears to predict the future, but in reality, it is simply using information that was not available at the time. So the question becomes: How can a system correctly represent what was known, and when it was known?
Enter: bitemporal data
Bitemporal data allows us to answer questions like:
- What did we know about this company on January 15, 2025?
- What financials were available to an investor on that date?
- Which version of the truth existed at that moment in time?
The key idea is that financial systems require two dimensions of time.
- Effective time: what the data describes.
- Knowledge time: when the data became available.
By separating effective dates from knowledge dates, we can build systems that are historically accurate, auditable, and suitable for backtesting, compliance, and serious financial analysis.
Let’s look at a clear example of a bitemporal table.
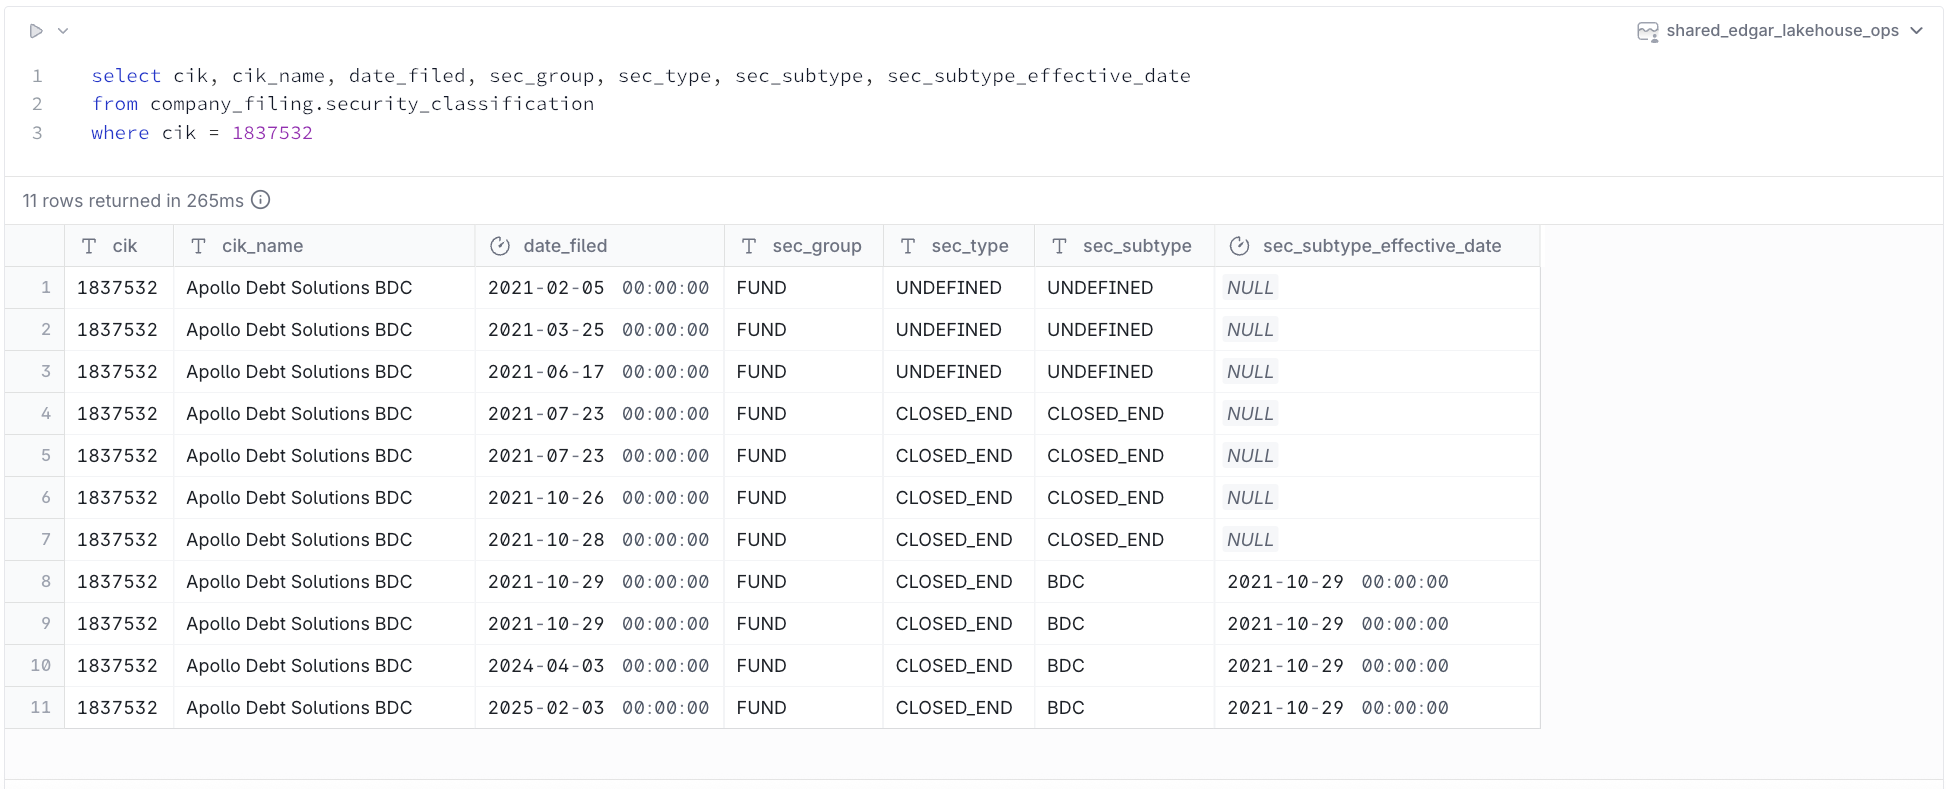
This table is a filing-driven classification timeline. More precisely, it is a bitemporal classification history for an SEC registrant (CIK 1837532, “Apollo Debt Solutions BDC”), showing what the system believed the entity was (fund, BDC, etc.) during different time windows, based on filings.
What does each row represent?
- Each row is a filing event (form type and filing date) that triggered a classification record.
- That classification is considered valid between two timestamps.
- valid_from represents when the classification became active.
- valid_to represents when it stopped being active. A NULL valid_to means it is still the current classification.
This is effectively a Slowly Changing Dimension (SCD Type 2) timeline for registrant classification - meaning we preserve each historical version rather than overwriting it.
It gives us a clear timeline of how Apollo Debt Solutions BDC progressed through the SEC filing process and eventually became classified as a BDC.
From here, we can start to build a much more powerful analysis.
For example, we can write queries that compute how many BDCs were active at each year-end going back to 1993. Instead of counting all BDCs that have ever existed, we count only the BDCs that were actually known and active at that point in time.
This difference matters.
It enables accurate historical market analysis, trend detection, and a deeper understanding of how the industry evolves. It also makes it possible to write market insights that are grounded in what investors could truly observe at the time, rather than what we know today.
Time series data is powerful. But in finance, a time series without bitemporal accuracy is incomplete. At Opto, we see bitemporal data as foundational infrastructure - because it lets us answer the questions that actually matter: what changed, when did it change, and when did we know it? Without that, the narrative you extract from your data may not be trustworthy.
For disclaimers, visit https://www.optoinvest.com/disclaimers.